PHP X-Ray is a feature of CloudLinux, the popular operating system that we use on our web hosting servers, that provides detailed insights into the performance of PHP-based web applications. It is designed to help site owners, web developers and system administrators identify and troubleshoot performance issues related to WordPress, but also any other PHP code and PHP-based scripts.
PHP X-Ray works by collecting detailed information about the execution of PHP scripts, including function calls, database queries, and other operations. This information is then aggregated and presented in an easy-to-read format, allowing you to quickly identify performance bottlenecks and other issues. For example, for WordPress sites, PHP X-Ray can help you determine which plugins or themes cause your site to be slower than usual.
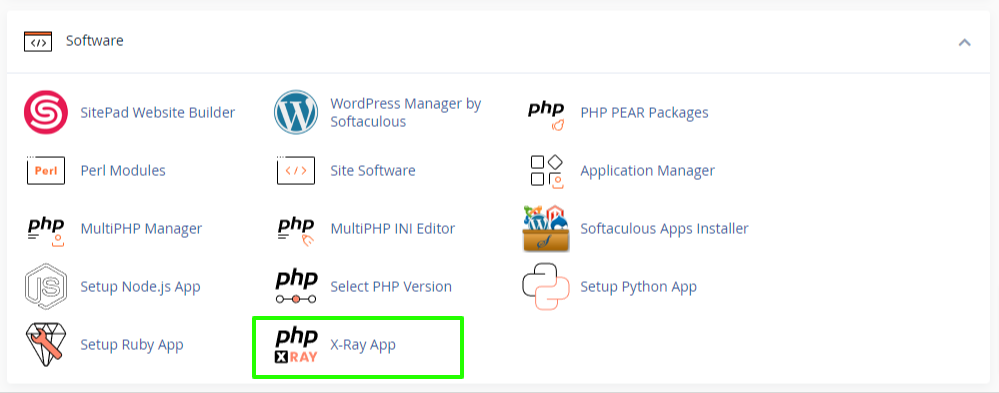
To use PHP X-Ray in cPanel, you will first need to ensure that the PHP X-Ray feature is available for your server and cPanel account. You can check this by logging into cPanel and navigating to the "Software" section. There you should find the "X-Ray App" button, if available.
Note: PHP X-Ray is currently only available for Enterprise hosting plans or VPS/Dedicated servers with an active CloudLinux OS Shared Pro license. We are gradually rolling it out to a limited number of Enterprise hosting servers. If you have an Enterprise hosting plan and require this feature, or if you'd like to purchase CloudLinux OS Shared Pro for your server, please contact our technical support department.
Step 1 - Open PHP X-Ray
If PHP X-Ray is available for your server or hosting account, you will find it as follows:
- Log in to cPanel (here's how: Accessing your hosting control panel (cPanel))
- Navigate to the Software section and click on X-Ray App button:
If the X-Ray App button is not shown, then this feature is not yet available for your hosting plan or server. Please upgrade to an Enterprise hosting plan or contact us if you already have one. If you have a VPS or Dedicated server, please purchase a CloudLinux OS Shared Pro license and contact us to have PHP X-Ray installed on your server.
Step 2 - Disable caching
To assure that the PHP scripts are executed to collect the necessary data, please disable any caching plugins or exclude the necessary pages/scripts from caching. Otherwise, X-Ray would only get static HTML data and be unable to check the PHP code.
Many CDNs, such as CloudFlare, are also responsible for caching, although they usually don't cache PHP pages. If the tracing task doesn't collect any data, please try to disable any CDN as well.
Step 3 - Start a tracing task
On the X-Ray App page, click on the Start tracing button to add a new task:
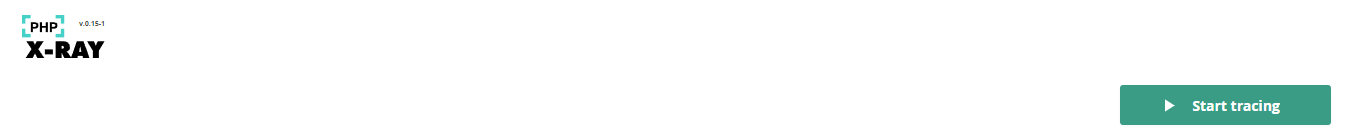
A window titled "Start tracing" will appear:
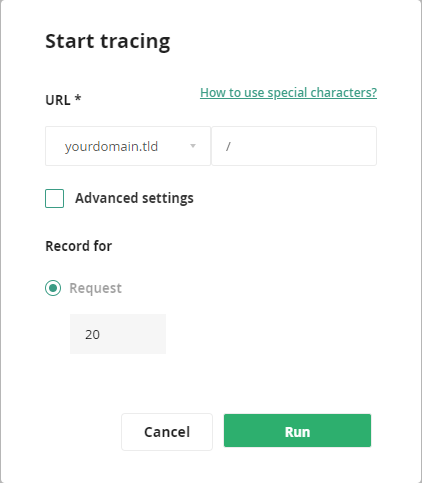
Here you can select the following:
- Choose domain: Select your domain or sub-domain from the drop-down menu. Select the one where the PHP script or site that you'd like to analyse is hosted.
- Specify mask: To analyse the front page of your site, simply enter
/or/index.php. Otherwise, enter the path of the script or page that you'd like to analyse. You can also analyse multiple scripts by using wildcards or regex patterns. Click on the "How to use special characters?" link for more details. - Advanced settings -> Client's IP: This is only required if you'd like to trace requests initiated from a specific IP address.
- Request: This is the number of requests that PHP X-Ray will trace. The field cannot be modified in cPanel. By default, 20 requests will be traced. This is necessary so you have multiple reports and enough data to confirm possible issues.
Click on the Run button to add the tracing task.
Step 4 - Open the tracing task
After you add the tracing task, you can find it on the main X-Ray App page under Tracing tasks:
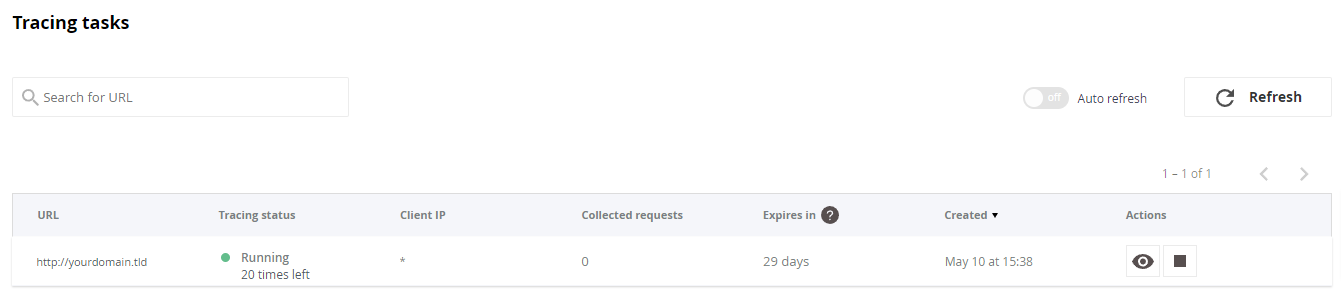
Click on the view icon (first button) under the Actions column to open it or on the stop icon (second button) to stop it if necessary.
Step 5 - Wait for the tracing task to collect data
The tracing task runs every time the page(s) or script(s) that you've defined are accessed. The more traffic your site has, the sooner data will be collected. You can also browse through your site or run the PHP scripts by yourself to have PHP X-Ray collect data.
If no tracing data is collected after a longer period of time (15-30 minutes), please assure that no caching is enabled. Follow these troubleshooting steps if the issue persists: I started a tracing task and made requests to URL but did not see any results in the UI. What should I do?
Step 6 - Analyse the tracing reports
Once one or more sessions have been recorded, you will see them under the Recorded sessions list. Please make sure to enable auto refresh or remove any enabled filters if the list is empty.
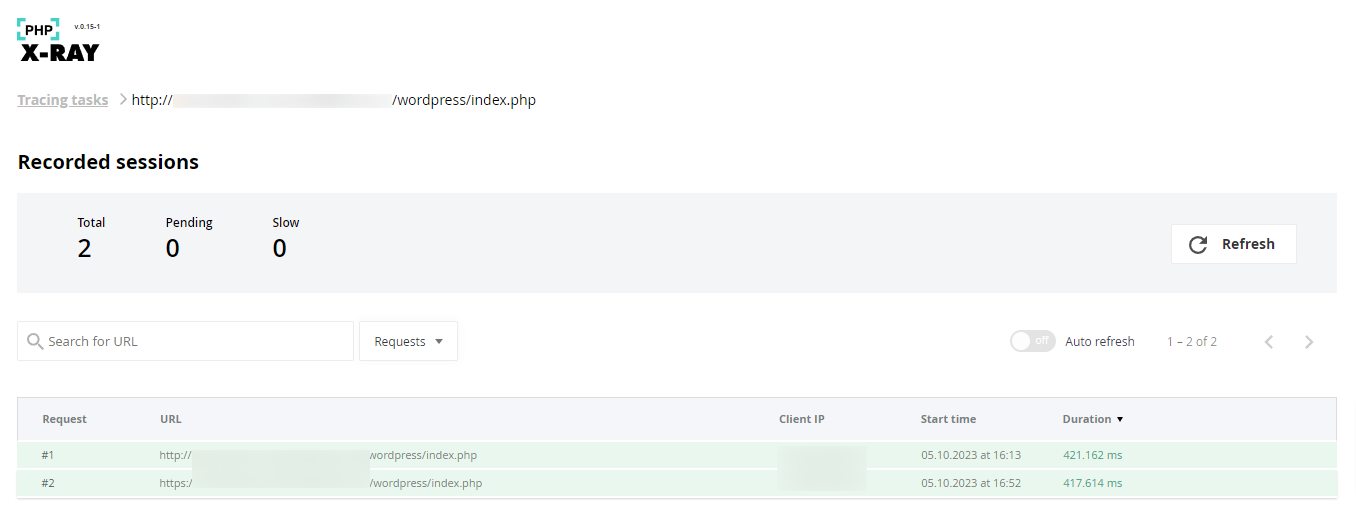
Click on one of the requests from the list to see the detailed reports and metrics related to the performance of your application, including CPU usage, memory usage, and database queries by clicking on one of the tracing tasks.
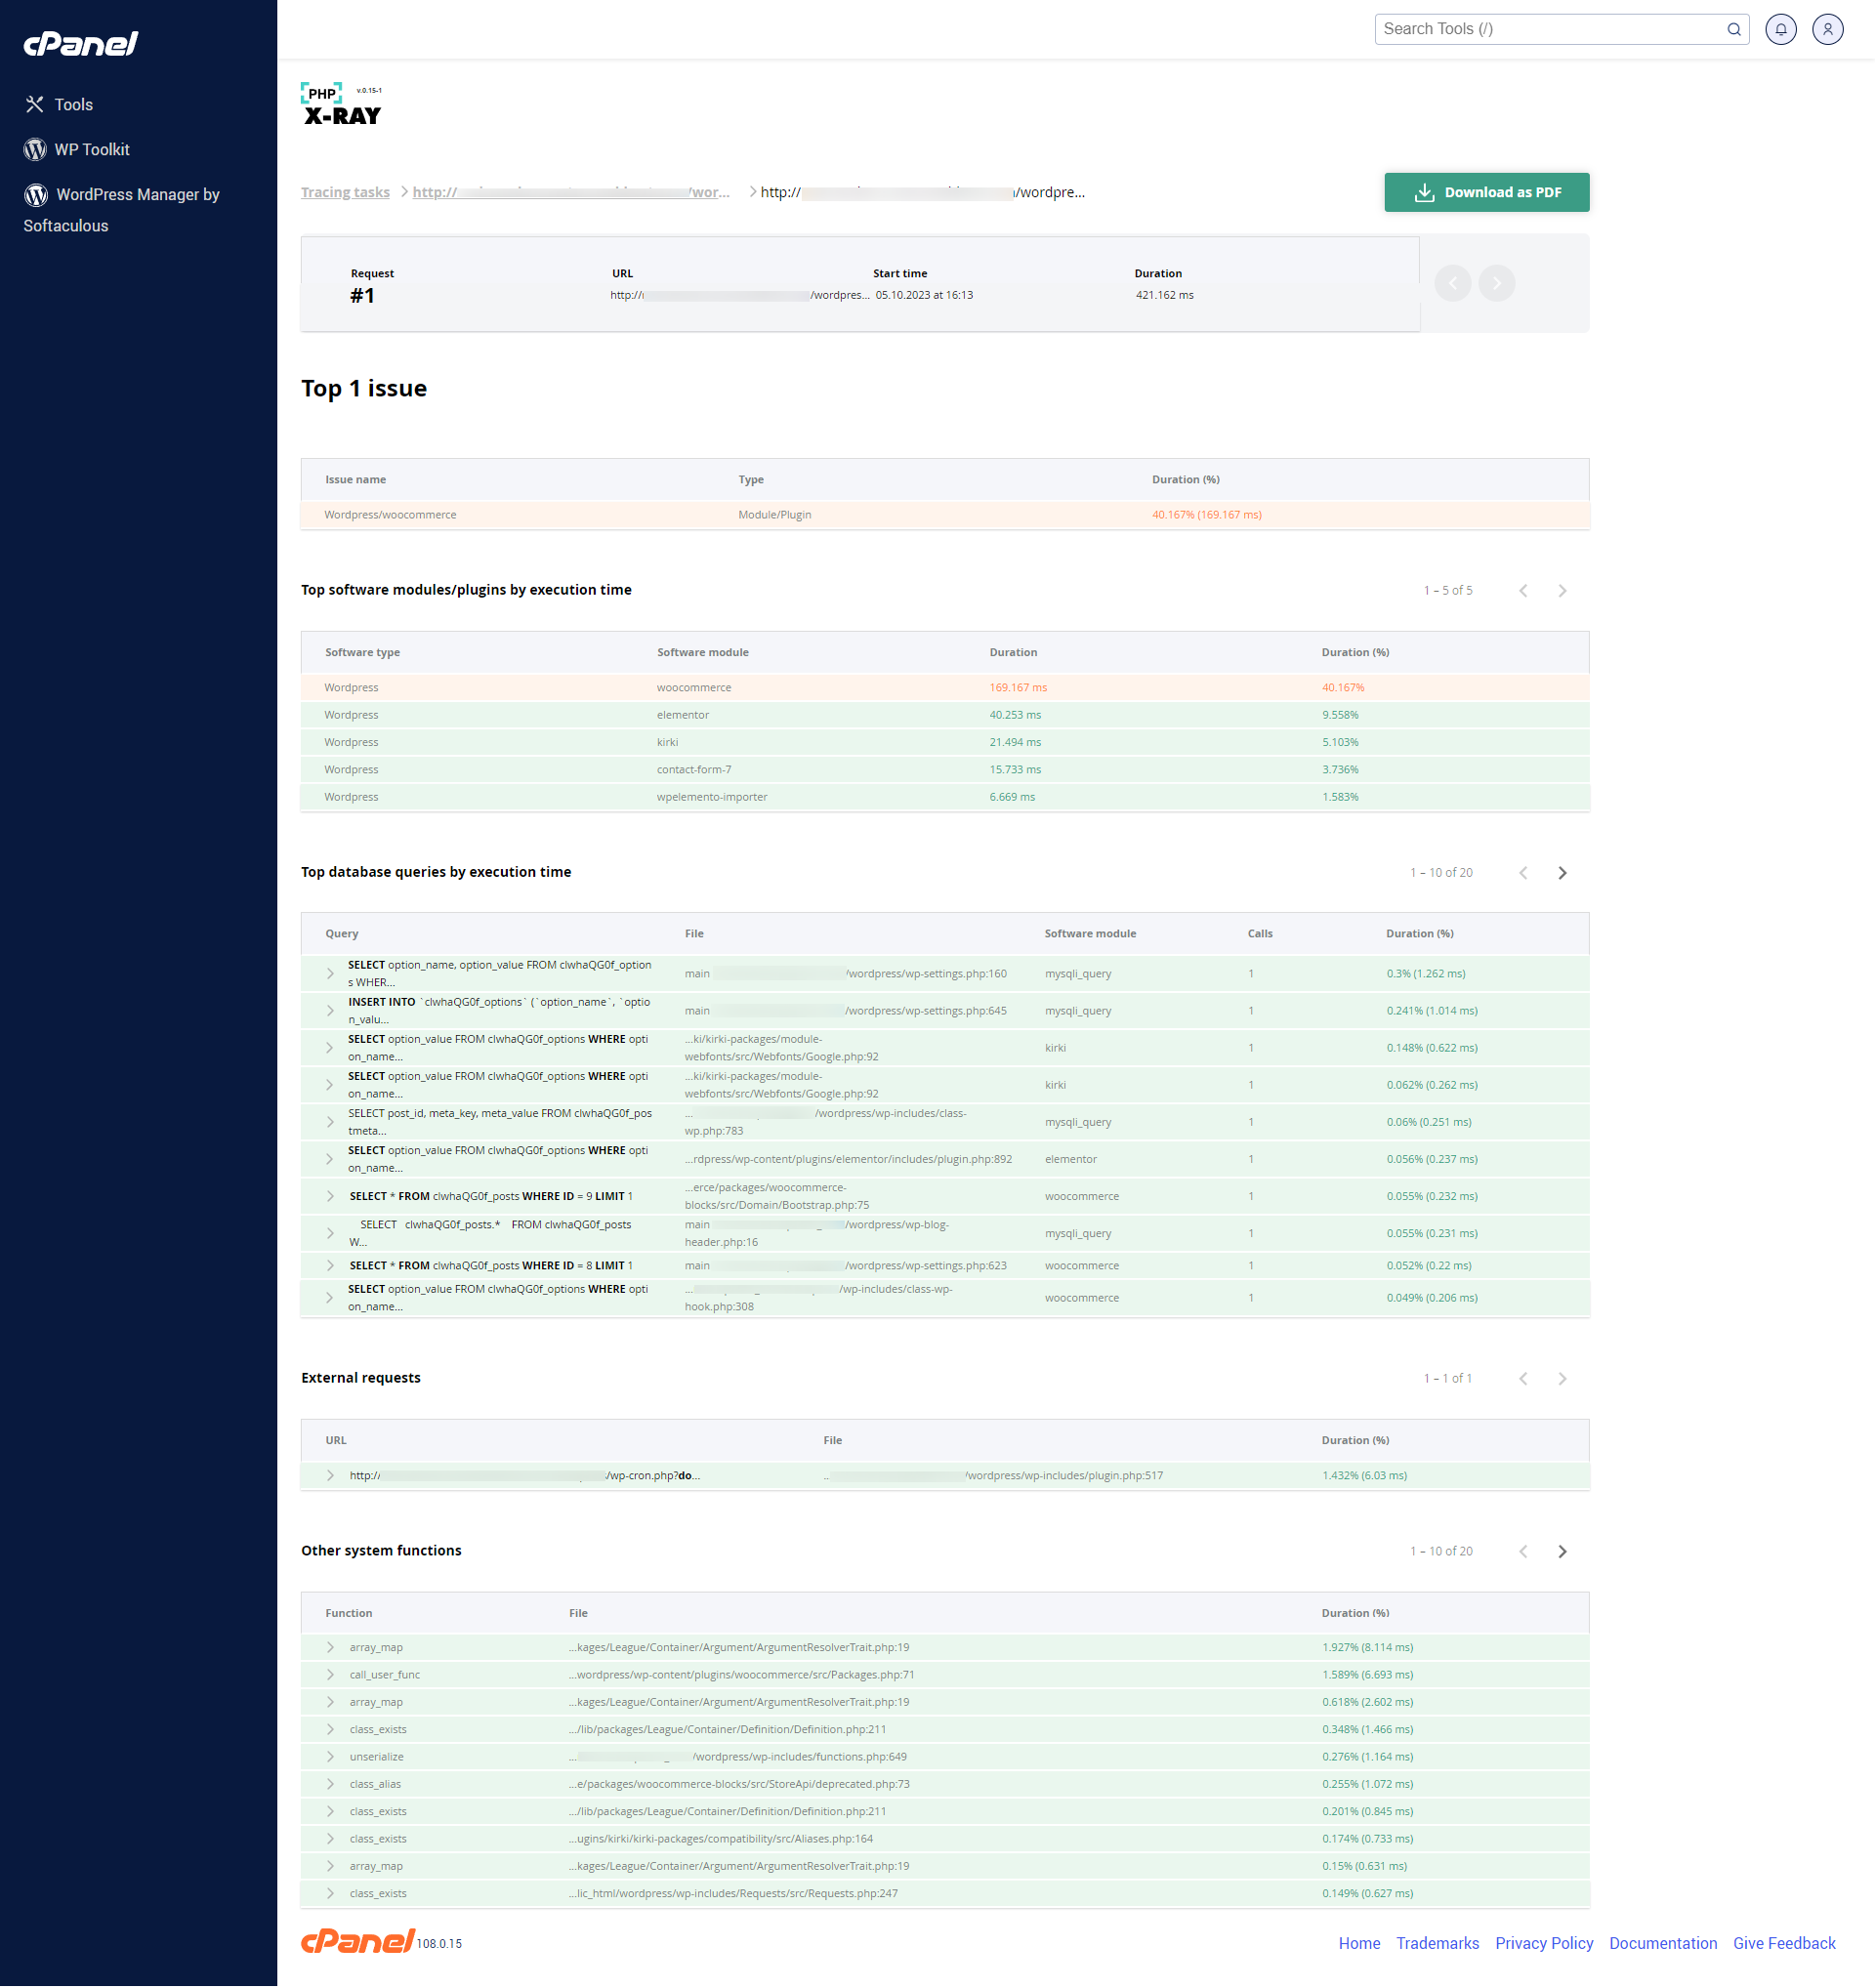
Below we'll add a sample tracing report where PHP X-Ray has identified the WooCommerce WordPress plugin as the main issue causing our test site to be slower. The report can be downloaded and forwarded to your developer by clicking on the Download as PDF button.
The report also shows any possible SQL queries, external requests or other system functions slowing down your site/code.
Conclusion
Overall, PHP X-Ray is a powerful tool for monitoring and optimizing the performance of PHP applications on a web hosting server, and it can help developers and system administrators identify and troubleshoot performance issues more quickly and effectively.
Updated by SP on 10/05/2023


